A real-time NSE scanner that ranks stocks with rule-based quantitative analysis and builds a full entry-to-exit trading plan for each one.
PROJECT
NSE Intraday Opportunity Scanner
MY ROLE
Full-stack design & engineering · Built end-to-end
TIMELINE
2026 · Independent project
THE CONTEXT
Start with the people. Understand the problem.
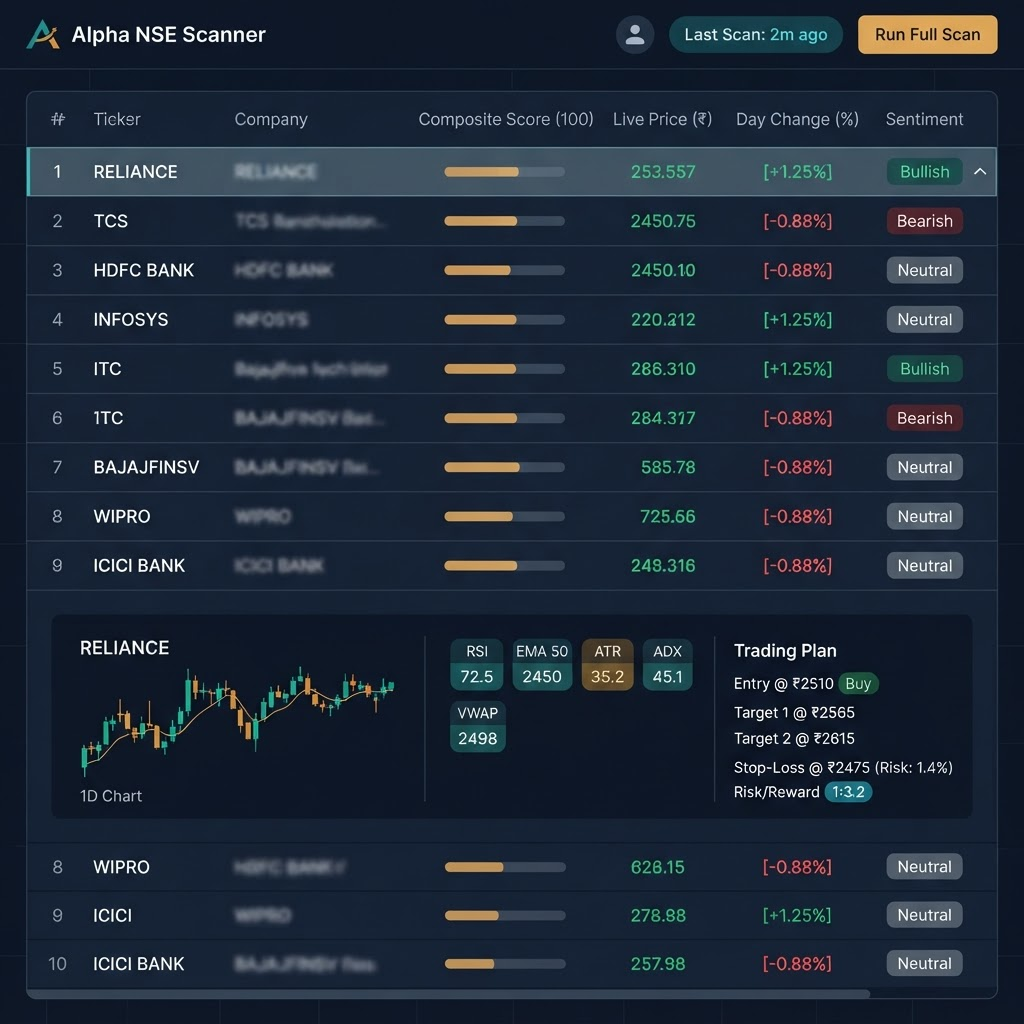
A web app that fetches real NSE market data—current prices and multiple 5-minute candles per stock, not just the last few—and runs it through a multi-stage pipeline: validate liquidity, calculate indicators (RSI, EMA20/50, ATR, ADX, DI, VWAP, volume average, relative volume, breakout levels, day-change %), score momentum/volume/breakout/trend/volatility, and rank every stock on a composite score out of 100. The dashboard surfaces the ranked list with live price, score breakdown, bias and confidence, and refreshes automatically every 10 minutes.
THE CHALLENGE
A ranked list isn’t a trading plan.
A ranked list of scores is not a trading plan, and a trading plan nobody can audit is not trustworthy. The system needed to turn a pile of indicators into a bullish/bearish/neutral call with a confidence level, and then into concrete numbers—entry window, entry time, target, stop-loss, exit time, square-off guidance—while still showing the reasoning behind every candidate. It also had to run entirely on free infrastructure: no paid AI tokens, no paid search, no API keys, deployable on free hosting like Vercel.
THE APPROACH
Build the pipeline that can explain itself.
I designed and built the complete system: the data-fetching layer, historical candle validation, indicator calculations, the composite scoring model, the bias/confidence logic, the entry-to-exit timing plan, the auto-refresh behavior, and the dashboard that presents all of it—including the risk/reward levels and the reasoning behind each ranked stock. Every score and every plan is produced by deterministic, rule-based logic rather than an opaque model, so a trader can see exactly why a stock ranked where it did.
01
Show the reasoning, not just the rank
Every candidate on the dashboard carries its score breakdown and technical indicators alongside the ranking, so the number is never disconnected from why it exists.
02
A plan is entry, exit, and risk—together
Each stock resolves into a concrete intraday plan: entry window and time, target, stop-loss, exit time, and square-off guidance, not just a directional bias.
03
Deterministic over opaque
Scoring and bias come from quantitative rules applied to real candle data, not a black-box model, so the same inputs always produce the same, explainable output.
04
Free to run, free to trust
No paid AI tokens, search, or API keys—built on a free market-data source so it can run on free hosting and stay accessible.
THE THINKING BEHIND THE INTERFACE
Turn a pile of indicators into a plan a trader can audit.
Raw technical indicators are not a decision. The system had to fetch real NSE prices and multiple 5-minute candles per stock, run them through liquidity checks and indicator math (RSI, EMA20/50, ATR, ADX, DI, VWAP, volume average, relative volume, breakout levels, day-change %), and turn all of it into a ranked, explainable trading plan—without relying on paid AI, paid search, or API keys.
DESIGNED FOR
Intraday traders scanning NSE stocks for rule-based, explainable trade candidates
A UX reading of the supplied artifacts. The sequence below explains the design logic, not a verified chronology of research. Intended benefits and proposed tests are not measured outcomes.
The user's path
Scan the ranked list
Open a candidate
Review score breakdown & indicators
Read bias, confidence & reasoning
Check the entry-to-exit plan
PROCESS & ARTIFACTS
How the problem becomes an interface.
01
Design the pipeline before the screen
Fetch real candles, validate liquidity, calculate indicators, score momentum/volume/breakout/trend/volatility, then rank on a composite score out of 100. The dashboard is a presentation layer over a defined, deterministic pipeline.
02
Pair every score with its reasoning
A composite score alone invites blind trust. Each ranked stock shows its indicator breakdown and the reasoning behind the bias and confidence level, so the number is never disconnected from why it exists.
03
Turn a bias into an actual plan
Bullish, bearish, or neutral with a confidence level still leaves a trader to guess at timing. The design resolves each candidate into current price, entry window, entry time, target, stop-loss, exit time, and square-off guidance.
04
Design for continuous, not one-time, use
The scanner auto-refreshes every 10 minutes and supports manual re-scanning, so the dashboard had to stay legible as rankings shift rather than only working on a first look.
The live, deployed dashboard: ranked candidates with score breakdown, indicators, and a full entry-to-exit plan.
WHY IT IS DESIGNED THIS WAY
Every choice has a reason. And a trade-off.
Deterministic rules over an opaque model
A rule-based pipeline means every score and bias can be traced back to a specific indicator, which is what makes the plan auditable rather than a black-box suggestion.
THE TRADE-OFF
Rule-based scoring cannot adapt to patterns it wasn’t explicitly designed to catch the way a trained model might.
Full candle history over a few recent candles
Indicators like ADX, ATR, and EMA50 need enough history to be meaningful; a handful of recent candles would produce noisy, unreliable scores.
THE TRADE-OFF
Fetching and validating deeper history per stock costs more processing time on every scan.
Free data and free hosting by design
Avoiding paid AI tokens, paid search, and API keys keeps the tool accessible and deployable on free hosting like Vercel.
THE TRADE-OFF
Free market-data sources are less robust than paid feeds, so the pipeline has to validate and filter more defensively.
THE LIVE APP
Real market data. Real, running pipeline.
The screen above is the deployed application—real NSE prices and candles running through the live scoring and planning pipeline, refreshing every 10 minutes, not a static mockup.
It would have been easier to hand the ranking off to an opaque model and call it AI-powered. Building it instead as a deterministic, rule-based pipeline—one where every score traces back to a visible indicator—took more work but means a trader never has to take a ranking on faith. This is a research and decision-support tool, not guaranteed financial advice.